OPUS10: Spare Parts Optimisation Software for Defence, Aerospace and Industry
To many, OPUS10 – one of the software tools in Opus Suite – is synonymous with cost effective spare parts optimization. With its realistic modeling of technology and support solution, rapid calculations, and results that reduce the spare part investment by 30% or more – while also increasing system availability – OPUS10 has indeed become an industry standard in this field. But as you will find below, OPUS 10 also has much more to offer.
Spare parts optimisation built for operational readiness
OPUS10 is used across defence, aerospace and other asset-intensive industries to model and optimise multi-echelon spare parts networks. It balances system availability against the cost of the spares, repairs and support organisation needed to achieve it. OPUS10 answers questions such as:
- Which spare parts should we stock, and how should they be allocated across stock locations at the lowest cost?
- What is the best assortment when performance requirements differ by location and system type?
- How should the solution change during a time-phased roll-out or phase-out of systems?
- Should each component be repaired or discarded, for each type of failure?
- Should repairs be carried out locally or centrally?
- What will the inventory cost to reach a target performance within given support restrictions?
- How do efficiency and cost change if prices, failure rates or lead times rise by a given percentage?
Evaluating support solutions
OPUS10 goes beyond spares. It optimises the whole maintenance concept and compares alternative support solutions on cost and availability, including:
- The most cost-effective structure for the support organisation
- Where maintenance equipment and personnel should be located
- Whether to outsource all or part of maintenance
- How many warehouses are needed, and where
- The most cost-effective transport solution
- How sensitive the solution is to changes in the data or to inaccurate data
- How the organisation and inventory should change during ramp-up or phase-out
Evaluating technical systems and design choices
OPUS10 also supports design decisions by showing their effect on life cycle cost and availability:
- Which design and configuration is optimal from a supportability perspective?
- Is a more expensive, more reliable component better over the life cycle than a cheaper, less reliable one?
- Which upgrades and design changes justify their investment?
What OPUS10 can model
OPUS10 scales from a handful of components at a few locations to models with thousands of components, and optimises large cases in seconds. It models:
| Modelling area | What OPUS10 supports |
|---|---|
| Item types | Repairable items, discardable items, and items that are sometimes repaired and sometimes discarded |
| Maintenance | Scheduled and unscheduled maintenance |
| Fleet changes | Time-phased introduction and phase-out of systems |
| Support solutions | Item-specific support solutions |
| Product structure | Physical or maintenance-based product breakdown structures |
| Criticality | Different criticality levels for items |
| Requirements | Multiple optimisation requirements per location, unit or system type |
Industries that use OPUS10
OPUS10 is used by defence and aerospace organisations and by other asset-intensive industries, including transport and renewable energy. Read more about OPUS10 application areas.
How OPUS10 integrates with LSA and ERP systems
Spare parts optimisation depends on accurate data held in LSA tools, ERP, PLM, maintenance systems and other databases. Through Opus Suite+, OPUS10 connects to these sources in three ways:
- Standards-based connectors for ASD S-Series and GEIA-STD-0007 data, including S3000L-compliant LSA tools
- Direct integrations with leading LSA platforms, such as Raytheon EAGLE and ISS SLICwave
- API-based integration for proprietary or custom IPS environments
This keeps OPUS10 models linked to the source data, so results stay traceable to the original Logistic Support Analysis Records (LSAR).
Frequently Asked Questions
What is OPUS10?
OPUS10 is Systecon's spare parts optimisation software, now part of Opus Suite+. It finds the cost-optimal range, quantity and location of spares and the best maintenance concept to meet availability targets, typically reducing spare parts investment by 30% or more.
What does OPUS10 optimise?
OPUS10 optimises spares stocking, level of repair and the support organisation for a fleet of complex systems. Its results show the cost-optimal spares mix at each location, the recommended maintenance concept and the resulting operational availability.
How does OPUS10 differ from inventory management software?
Inventory management software tracks the stock you have. OPUS10 decides what stock should exist and where, based on failure rates, repair policies, lead times and availability targets, and models the full support solution to minimise life cycle cost.
What is the difference between OPUS10 and SIMLOX?
OPUS10 is a steady-state optimiser that finds the cost-optimal sparing and maintenance concept. SIMLOX is a discrete-event simulator that tests how that concept performs over time in specific scenarios. The two are designed to be used together in Opus Suite+.
Which defence programmes use OPUS10?
OPUS10 is used by defence forces across NATO and allied nations, on programmes including F-35, GCAP, Eurofighter, A400M, the Queen Elizabeth-class carriers, the Type 26 frigate, CV90 and Leopard 2.
Related resources
- Case study: optimising availability, maintainability and cost for AMDR
- Knowledge Center: spare parts optimisation with OPUS10
- Readiness Based Sparing (RBS)
- Life Cycle Cost (LCC)
- Take the Opus Suite+ tour
Read more about application areas
Previous versions release information
Upcoming courses
| Course | Date | Location | |
|---|---|---|---|
| OPUS10 & SIMLOX Basic Course | Virtual, North America | Learn more |
Quick tour
Data Input
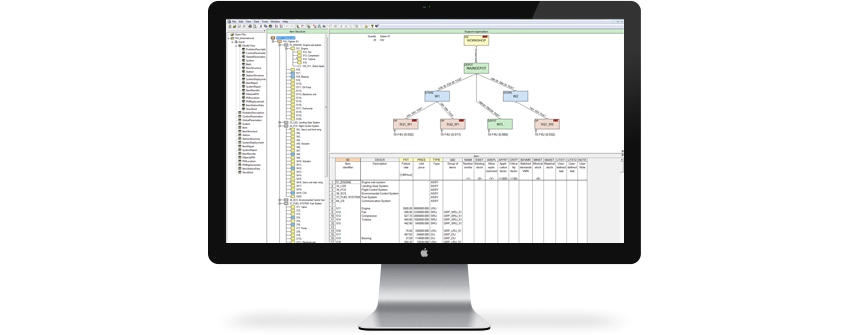
The scenario to be analyzed is described in the OPUS10 model, which is based on tables that are used in a flexible way depending on, for example, complexity and desired level of detail. A “model view” gives the user overview and support when building the model, along with a graphic representation of the technical system and its product structure, as well as the logistic support solution.
The C/E Curve
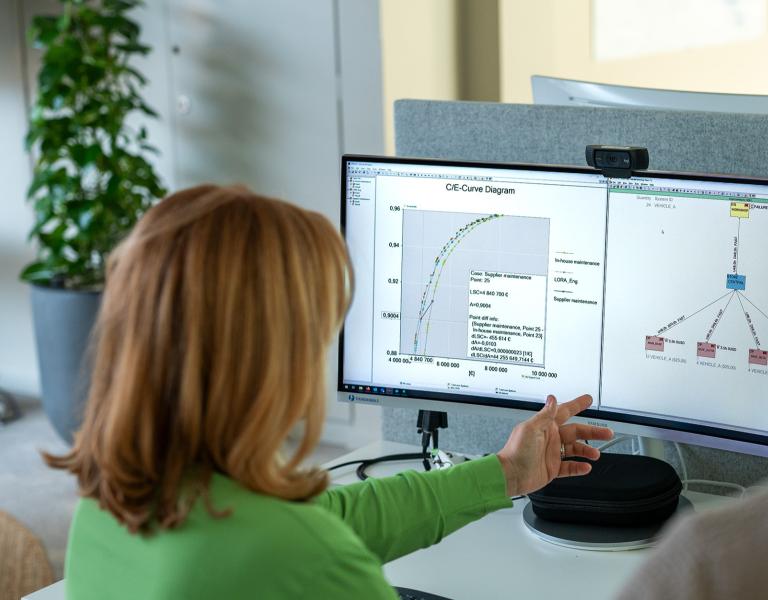
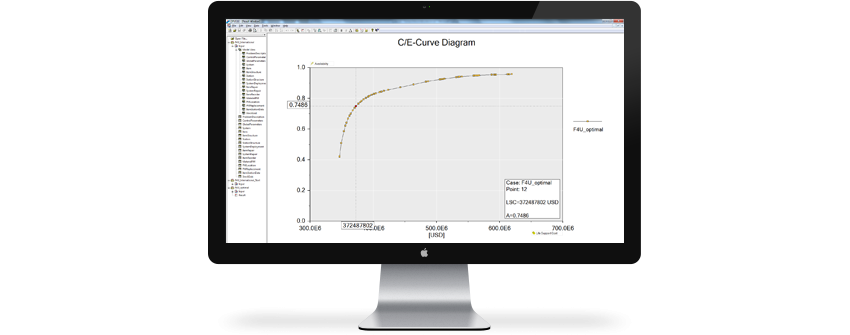
The Cost/Efficiency (C/E) Curve is a key step in OPUS10 optimization. A series of solution points is generated for a described scenario, showing maximum achievable system efficiency at different budgets. One solution point is selected, based on efficiency requirements and/or budget. The optimized solution behind the point can then be examined in the Table view, the Analysis view, or in the Reports section. By generating C/E curves for different scenarios in the same graph, their cost efficiency can be compared side by side.
Table View
The OPUS10 Results View features an interactive table allows you to easily select which solution points, parameters and dimensions to study. For instance, you can list stock levels, investments and service levels per component and location.
The Report Generator
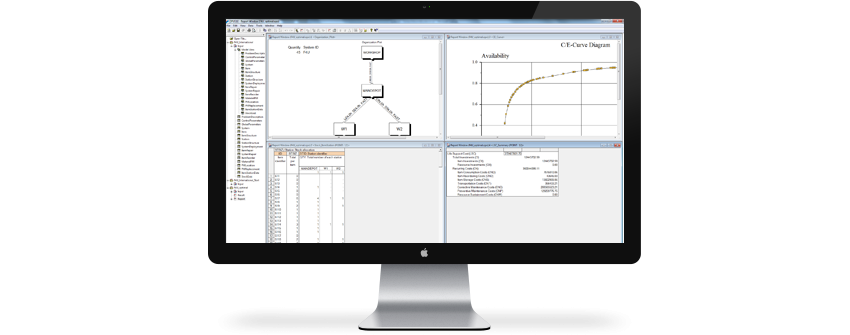
The OPUS10 Report Generator provides reports that can be customized to show the results that are of interest. There is a great number of result tables and fields to choose from. The reports are easily exported to MS Excel or external databases and ERP systems.