News Opus Suite v2024.1
Identification of downtime drivers
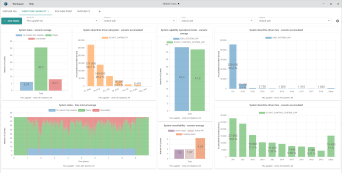
In this version of SIMLOX it is possible to get information about which subsystem, or item, that result in a system not being able to perform its desired operation, the so called "drivers of downtime". Downtime in this context is defined as the time that a system is not capable for an operational mode, due to one or several failures. For example, it is now possible to analyze what component to blame for the system not being able to perform search and rescue operations. Depending on how you want to allocate the blame you can get the answer by subsystem or by items.
More results available in our new views
In this release, we have introduced new visualizations also for results from OPUS10. In addition, the recently introduced viewer of SIMLOX results has been improved and complemented by some new features. The focus of these new views is to make it easier to access and understand the outcome from the analysis.
Some of the new key features are:
- Dashboard Creation - Effortlessly design customized dashboards tailored to your analysis.
- Workspace Management - Save and store a set of dashboards connected to your project or analysis.
- Export Options - Export dashboards as images or CSV tables for seamless report creation.
- Tutorial Support - Access tutorials for guidance on how to use the result viewer.
- Tooltips - Hover over elements to get short explanations, e.g., the meaning of the result parameter ‘stock size’.
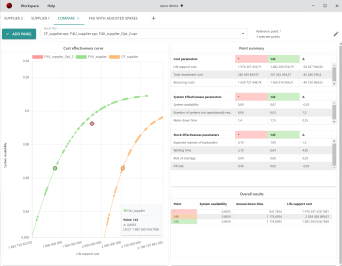
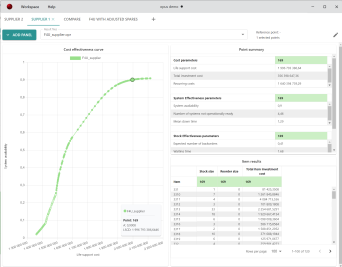
In the result viewer for OPUS10, the following panels are available:
- Cost Effectiveness Curve - Choose points on the curve(s) and all other graphs and panels will show corresponding results. Several metrics are available.
- Point Summary - Displays the most important data from your selected point and allows you to compare it to a defined reference point.
- Cost Breakdown - View the entire cost breakdown for a selected point, or choose to focus on higher-level cost categories.
- Result Tables - Configurable tables showing various results from OPUS10.
- Item Result Table
- Item Static Result Table
- System Result Table
- System Static Result Table
- Task Results Table
- Overall Result Table


Click to expand the pictures
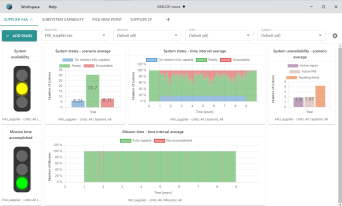
In the result viewer for SIMLOX, the following panels are available:
- Chart Panels - Charts that include time or total results, presented as either averages or accumulated values. The following results can be visualized in the chart panels:
- System States
- System Unavailability
- System Capability (Operational Mode)
- Mission Time
- Traffic Light Indicators - Set thresholds and receive color-coded indications based on whether values fall within, below, or above these thresholds. The following results can be visualized with the indicators:
- System Availability
- System Time Capable
- Mission Time Accomplished
- Mission Time Fully Capabl
- Mission Time Not Capable
- Downtime Driver Graphs - Linked to capability graphs, these charts help you understand downtime drivers for subsystems and items.


Click to expand the pictures
These new result presentations are a step in the modernization of the Opus Suite user interface. We encourage anyone from the user community to engage and share feedback through the support channels. Please use the subject "New Result Viewers".
Note that, at the moment, the new result viewers are opened as separate executables, available from a sub-folder to the OPUS10/SIMLOX installation (e.g. \Program Files\Systecon\OPUS10 2024.1 \OPUS10-Result-Viewer).
Download Opus Suite v2024.1 Release Notes >>
Previous releases:
Opus Suite v2021.1
Opus Suite v2021.2
Opus Suite v2022.0
Opus Suite v2022.1
Opus Suite v2022.2
Opus Suite v2023.0
Opus Suite v2023.1
Opus Suite v2024.0